Maximizing Model Performance: How to Identifying False Prediction Labels in Classification Machine Learning Models

May 8, 2024

In machine learning, it is common for classifiers to make incorrect predictions. These incorrect predictions can be referred to as false prediction labels. Identifying false prediction labels is important because it can affect the accuracy of the classifier model by having control over the data.

Fortunately, there are ways to easily find these false prediction labels in a classifier machine learning model. But one way is to use the code I have provided in my project. The way I used it, involves creating a data frame of the true labels and the data set counters. Then, predict the model on test data and define the prediction labels. Finally, print the true label column with their counters and the predicted labels. By doing so, you can compare the true labels with the predicted labels and identify any discrepancies, which will help you determine the false prediction labels in the classifier machine learning model.

Find my code attached herewith, which can be incorporated into your model post-training for optimal results:

                
                    #Get the number of test data (Based on your test size)
                    num = 100

                    #Predict the model on test data and let it define the labels
                    pred_labels = model.predict(X_test)

                    #Create a data frame of test's true labels and the predicted lavbels 
                    testdf=pd.DataFrame(X_test)
                    predictdf=pd.DataFrame(pred_labels)

                    #Just print the true label column with counters from your data set
                    print(testdf["Label"])

                    #See the predicted labels to compare
                    print(f"pred_probs for first {num} examples in format expected by cleanlab:")
                    print(pred_labels[:num])


Furthermore, this code enables you to export and preserve both the test data labels and predicted labels in a .csv file to easily compare them:

                
                    #In the code above make data frames from the true labels of testing data and the predicted labels. 
                    #Now we can merge and save them in a single .csv file

                    check=[dftest,predict]
                    checklist = pd.concat(check,ignore_index=True)
                    checklist.to_csv("Checklist_of_false.csv")


How to show a visualize confusion matrix in classification ML algorithms

May 7, 2024

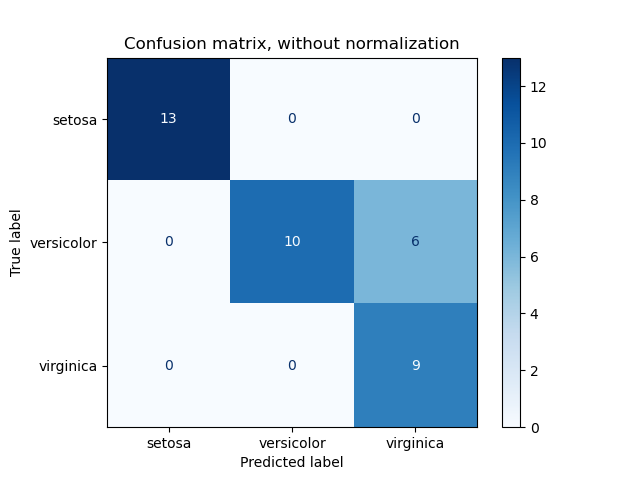
A confusion matrix is a special kind of contingency table, with two dimensions ("actual" and "predicted"), and identical sets of "classes" in both dimensions (each combination of dimension and class is a cell in the matrix). It is an N x N matrix used for evaluating the performance of a classification model, where N is the number of target classes. By definition, a confusion matrix C is such that C[i,j] is equal to the number of observations known to be in group i and predicted to be in group j. You can use the sklearn.metrics.confusion_matrix function in Python to create a confusion matrix for a given classification model.

This article provides a code with which you can display the confusion matrix as an illustrated plot with better details.

ConfusionMatrixDisplay is a class in the sklearn.metrics library which can be used to plot a confusion matrix, with added matplotlib.text.Text objects for evaluation measures such as accuracy, precision, recall, and f1 score. Here is an example of how to use ConfusionMatrixDisplay for plotting a confusion matrix in Scikit-learn:

                
                    from sklearn.metrics import confusion_matrix
                    from sklearn.metrics import ConfusionMatrixDisplay

                    titles_options = [("Confusion matrix")]
                    target_names=["class1", "class2", "class3"]

                    conf = confusion_matrix(y_test, prediction)
                    for title in titles_options:
                        disp = ConfusionMatrixDisplay.from_estimator(model,X_test,y_test,display_labels=target_names,cmap=plt.cm.Blues)
                        disp.ax_.set_title(title)
                        print(title)
                        print(disp.confusion_matrix)

                    plt.show()


The plot will show the confusion matrix and evaluation measures like accuracy, precision, recall, and f1 score. This is an example of the confusion matrix visualization for three classes:

Confusion matrix

The perpose

May 5, 2024

Here are mostly the latest technology topics, especially artificial intelligence and programming, and any topic that I know and can provide a constructive opinion or training about.